17 fewer hours, 19 more watts: my power zones, 2025 vs 2026
Two seasons of Strava power data: 17 fewer hours, FTP up from 261 to 280 W. Where my time in power zones went, and the gap it exposed.

Goal of this post is to look at training, not races. My race spreadsheet shows results. It does not show why.
So I pulled every ride from the last two seasons and summed the time in power zones. 151 rides in 2025, 171 in 2026.
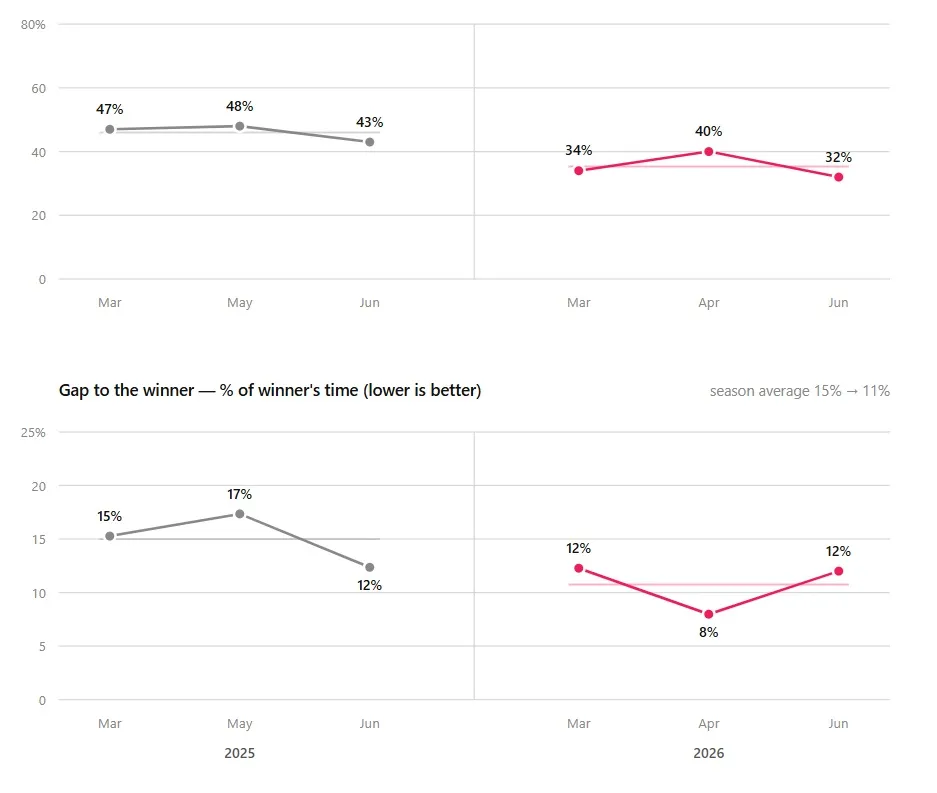
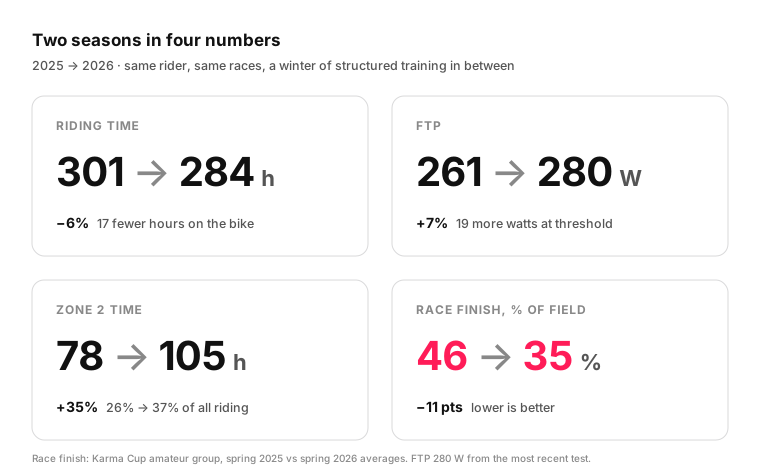
Result: 17 hours less riding, FTP up from 261 W to 280 W. That is +7% on 6% fewer hours. Race finish moved from 46% to 35% of the field, spring vs spring.
Threshold hours stayed flat, but the threshold work became structured. My intervals went from level 1 to level 12: from 20 to 42 minutes at threshold per session, with 1 minute rest instead of 3.
How the time in power zones was counted
Strava uses Andrew Coggan’s seven power levels:
| Zone | % of FTP | At 280 W |
|---|---|---|
| Z1 Recovery | below 55% | below 154 W |
| Z2 Endurance | 56–75% | 157–210 W |
| Z3 Tempo | 76–90% | 213–252 W |
| Z4 Threshold | 91–105% | 255–294 W |
| Z5 VO2 max | 106–120% | 297–336 W |
| Z6 Anaerobic | above 121% | above 339 W |
| Z7 Neuromuscular | sprints | - |
Each ride is scored against the FTP at that time. 2025 rides against 261 W. 2026 rides against 272 W (Jan–Mar), then 285 W.
The 285 W came from an indoor ramp test and it is too high. A ramp test takes FTP from the last minute of a rising effort. So a rider with a decent anaerobic kick gets more FTP than they really have. A recent test says 280 W, this is the number I trust. Strava still had 285 W, so the zone data uses it. If anything, my 2026 time in the upper zones is slightly understated.
A moving FTP also flatters progress. Same watts drop a zone when FTP goes up. So I ran the numbers a second time, with both seasons fixed at 285 W.
Two seasons, zone by zone
| Zone | 2025 % | 2025 h | 2026 % | 2026 h | Δ h |
|---|---|---|---|---|---|
| Rides / total | 151 rides | 301 h | 171 rides | 284 h | −17 |
| Z1 Recovery | 51.8% | 156 | 45.3% | 128 | −28 |
| Z2 Endurance | 26.0% | 78 | 37.1% | 105 | +27 |
| Z3 Tempo | 10.1% | 30 | 8.9% | 25 | −5 |
| Z4 Threshold | 6.0% | 18 | 5.8% | 17 | −1 |
| Z5 VO2 max | 3.3% | 10 | 1.5% | 4 | −6 |
| Z6 Anaerobic | 1.9% | 6 | 1.1% | 3 | −3 |
| Z7 Neuromuscular | 0.9% | 3 | 0.3% | 1 | −2 |
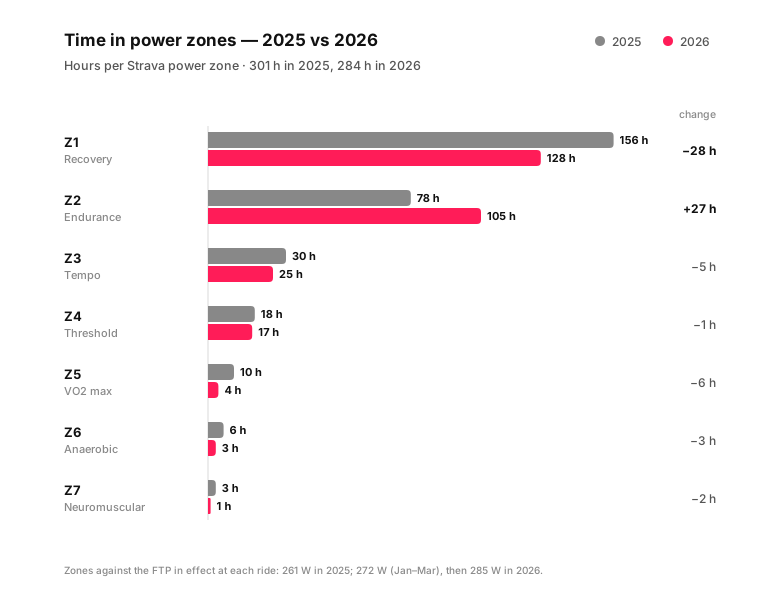
In 2025 more than half of my riding, 156 hours, was below 55% of FTP. Some of it is normal on MTB: descents, coasting, technical sections, waiting at junctions. But a lot of it was just slow riding. It did not train anything and it was too long to be recovery.
Ride count shows the same. 151 rides of almost 2 hours became 171 rides of about 1 h 40 min. More rides, shorter, each with a purpose.
Zone 2 is the whole story
Z1 lost 28 hours. Z2 gained 27. Almost hour for hour.
Z2 went from 26% to 37% of all riding, from 78 h to 105 h. Nothing else changed much.
This is the boring part of the method that does most of the work. Z2 sits below the first lactate threshold. Easy enough to repeat 4–5 times a week with a job and three kids. Hard enough to build the aerobic base that FTP sits on. Seiler’s review of elite training puts most of the training time there.
In my founder story I wrote that easy rides were the hardest thing to learn. Now I see it has two parts. Don’t attack every trail. And don’t just float either.
Same rides, same zones
Both seasons fixed at FTP 285 W:
| Season | Z1 | Z2 | Z3 | Z4 | Z5 | Z6 | Z7 |
|---|---|---|---|---|---|---|---|
| 2025 | 59.3% | 24.2% | 8.3% | 4.6% | 2.1% | 0.9% | 0.6% |
| 2026 | 47.7% | 35.6% | 8.5% | 5.5% | 1.4% | 1.0% | 0.3% |
The Z2 shift is still there, 24% → 36%. So it is not an effect of a moving FTP. Against this year’s FTP, 2025 was even more Z1-heavy: almost 60% of all riding. Threshold goes up slightly in this view, from about 14 h to about 16 h.
Threshold: same hours, different work
Threshold time stayed flat. 18 h in 2025, 17 h in 2026. But what is inside those hours changed:
- 2025: ad-hoc Z4. Attacking climbs and trails, races. Random efforts, random duration.
- 2026: structured Z4. Most of it came from planned sub-threshold intervals, just under LT2. Planned and progressive.
July to September was my first fully coached block in Superfly:
| Jul–Sep | Hours | Z2 | Z4 | Z5+ |
|---|---|---|---|---|
| 2025 | 133 h | 27.9% | 5.5% | 5.3% |
| 2026 | 107 h | 33.9% | 6.9% | 3.5% |
Z4 share went up, 5.5% → 6.9%. Hours did not: about 7.3 h then, 7.4 h now. Bigger share of a smaller total.
From level 1 to level 12
Superfly threshold intervals go up in levels. Every level is work at 88–92% of FTP with recovery at 40–60% of FTP. Complete 2 sessions at your level and the next one unlocks. This season I went from level 1 to level 12, so at least 22 completed sessions.
| Level | Intervals | Rest between | Work at threshold | Rest total |
|---|---|---|---|---|
| 1 | 4 × 5 min | 3 min | 20 min | 9 min |
| 2 | 4 × 5 min | 2 min | 20 min | 6 min |
| 3 | 6 × 4 min | 2 min | 24 min | 10 min |
| 4 | 5 × 5 min | 2 min | 25 min | 8 min |
| 5 | 5 × 5 min | 1 min | 25 min | 4 min |
| 6 | 6 × 5 min | 1 min | 30 min | 5 min |
| 7 | 5 × 6 min | 2 min | 30 min | 8 min |
| 8 | 5 × 6 min | 1 min | 30 min | 4 min |
| 9 | 6 × 6 min | 1 min | 36 min | 5 min |
| 10 | 8 × 5 min | 1 min | 40 min | 7 min |
| 11 | 7 × 6 min | 1 min | 42 min | 6 min |
| 12 | 6 × 7 min | 1 min | 42 min | 5 min |
Level 1 vs level 12:
- Work at threshold: 20 → 42 min per session, more than double.
- Rest between intervals: 3 → 1 min.
- Rest as share of work: 45% → 12%.
The target power stayed the same, 88–92% of FTP. What grew is the time just under LT2 and how little recovery I need between efforts.
Why Strava still shows flat Z4
- The zone line. Strava Z4 starts at 91% of FTP. My intervals are 88–92%. So a big part of every interval session is counted as Z3 tempo, not Z4. My structured threshold time is bigger than the Z4 number shows.
- Not every week has intervals. Recovery weeks and race weeks take their share.
My reading: FTP went up with the same threshold hours. Two things changed. A much bigger Z2 base, and threshold work that is planned and progressive instead of random. One rider and two seasons, but this is what the numbers show.
High intensity halved
Z5–Z7 together went from about 19 h to 8 h. In the coached block Z5+ went from 5.3% to 3.5%, roughly 7 h to under 4 h.
Two reasons:
- Fewer races. Most of my VO2 time comes from racing, and 2025 had more start lines.
- The method. Hard sessions stay submaximal. Nothing in my week goes above threshold on purpose.
Fine in a base block. Not fine for an XC racer. Starts, punchy climbs, closing a gap: these are VO2 efforts whether you train them or not. Outside of races I now do almost none. This is the biggest gap in my data.
Summer volume dropped
The coached block was 20% smaller: 133 h in Jul–Sep 2025, 107 h this year. The data can’t tell if that was planned or business taking the time. If planned, fine. If not, it is the real limit for next season.
How to check your own time in zones
- Sum a whole season. One ride is noise. 300 hours is a distribution.
- Run it twice. Once with the FTP of the day, once fixed at one FTP. If a shift shows in both, it is real. Also know which test your FTP came from, a ramp test can move all zones by a few percent.
- Read hours, not only %. My threshold % went up while threshold hours stayed flat.
- Check your Z1. If half your riding is below 55% of FTP, turning some of it into Z2 is the cheapest gain. No extra hours needed.
FAQ
How much time should an amateur cyclist spend in zone 2?
Most of it. A polarized week keeps most training time below the first lactate threshold, on Strava that is Z1 and Z2. More important than the exact % is that Z2 is deliberate, steady riding and not coasting.
Why is so much of my riding time in zone 1?
On a mountain bike, descents, coasting, technical sections and stops all count below 55% of FTP. So high Z1 is normal off-road. The problem is rides that sit in Z1 by accident: too easy to train, too long to recover.
Should time in zones use my current FTP or the FTP at the time of the ride?
Use the FTP at the time of the ride, then check again against one fixed FTP. If a shift shows up in both, it is a real change in training and not an effect of a new test.
Can you raise FTP without more threshold hours?
In my data, yes. FTP went from 261 W to 280 W while threshold hours stayed at 17–18 per season. What changed: 27 extra hours of Z2, and threshold intervals that progressed from 20 to 42 minutes of work per session.
Why do sub-threshold intervals show up as tempo in Strava?
Strava’s Z4 starts at 91% of FTP. Norwegian-style sub-threshold intervals are around 88–92% of FTP, so part of every session lands in Z3. Judge interval days by the session’s power, not by the zone colour.